


Wave is a surf forecast mobile application that I collaborated in as a Product Designer with a group of foreign surfers in Mazatlán, México. As the role UX and Visual designer, I designed this project from inception to final design through research, ideation and UX design principles.
Duration: 6 months.
Methods: Surveys, Interviews, Card Sort, Affinity Mapping, Preference Test, Wireframes, Prototyping.
Tools: Miro, Jira, Figma, Illustrator.

Spending a day out in the ocean can take a turn from “surf’s up” to stressful if forecasts are misinterpreted. In order for surfers to stay safe in the ocean, it’s important that they are well informed about weather conditions before they head out for a session.
However, surf reports can be complex and overwhelming, and the same forecasting information may not apply for surfers of varying skill levels. I was tasked with providing a mobile application that would allow surfers to find easily understandable surf forecasts that would help them find the perfect wave, every time.


Competitor Analysis
To get a better understanding of the competitor landscape, I conducted analyses on two of the most popular surf forecast apps on the market, and found that while both provided a wealth of information for surfers to read through, there was some information overload. This could prove overwhelming for some users, especially those new to the sport.
Surveys & Interviews
With the goal of understanding how surfers made use of existing forecasting methods, which features they thought were most important, and the issues they were facing, I surveyed 30 surfers of varying skill levels. I wanted to to understand how the users’ answers would vary depending on their skill level, so I separated my findings by users that were Beginner, Intermediate and Expert level surfers, and then interviewed two surfers at each level.
Key Findings & Insights
The surveys and interviews helped me understand more about the needs and frustrations of my users, and I was able to pull a few key findings that would help shape my project:

Search and Browse
An “explore” feature that would allow users to browse beaches based on their location and preferences.
Surf Forecasts
Easily understandable forecasts, including swell, wind and weather data, in both overview and detailed form.
Leave a Review
A review feature that would let users leave feedback or helpful tips about their experience at each beach.
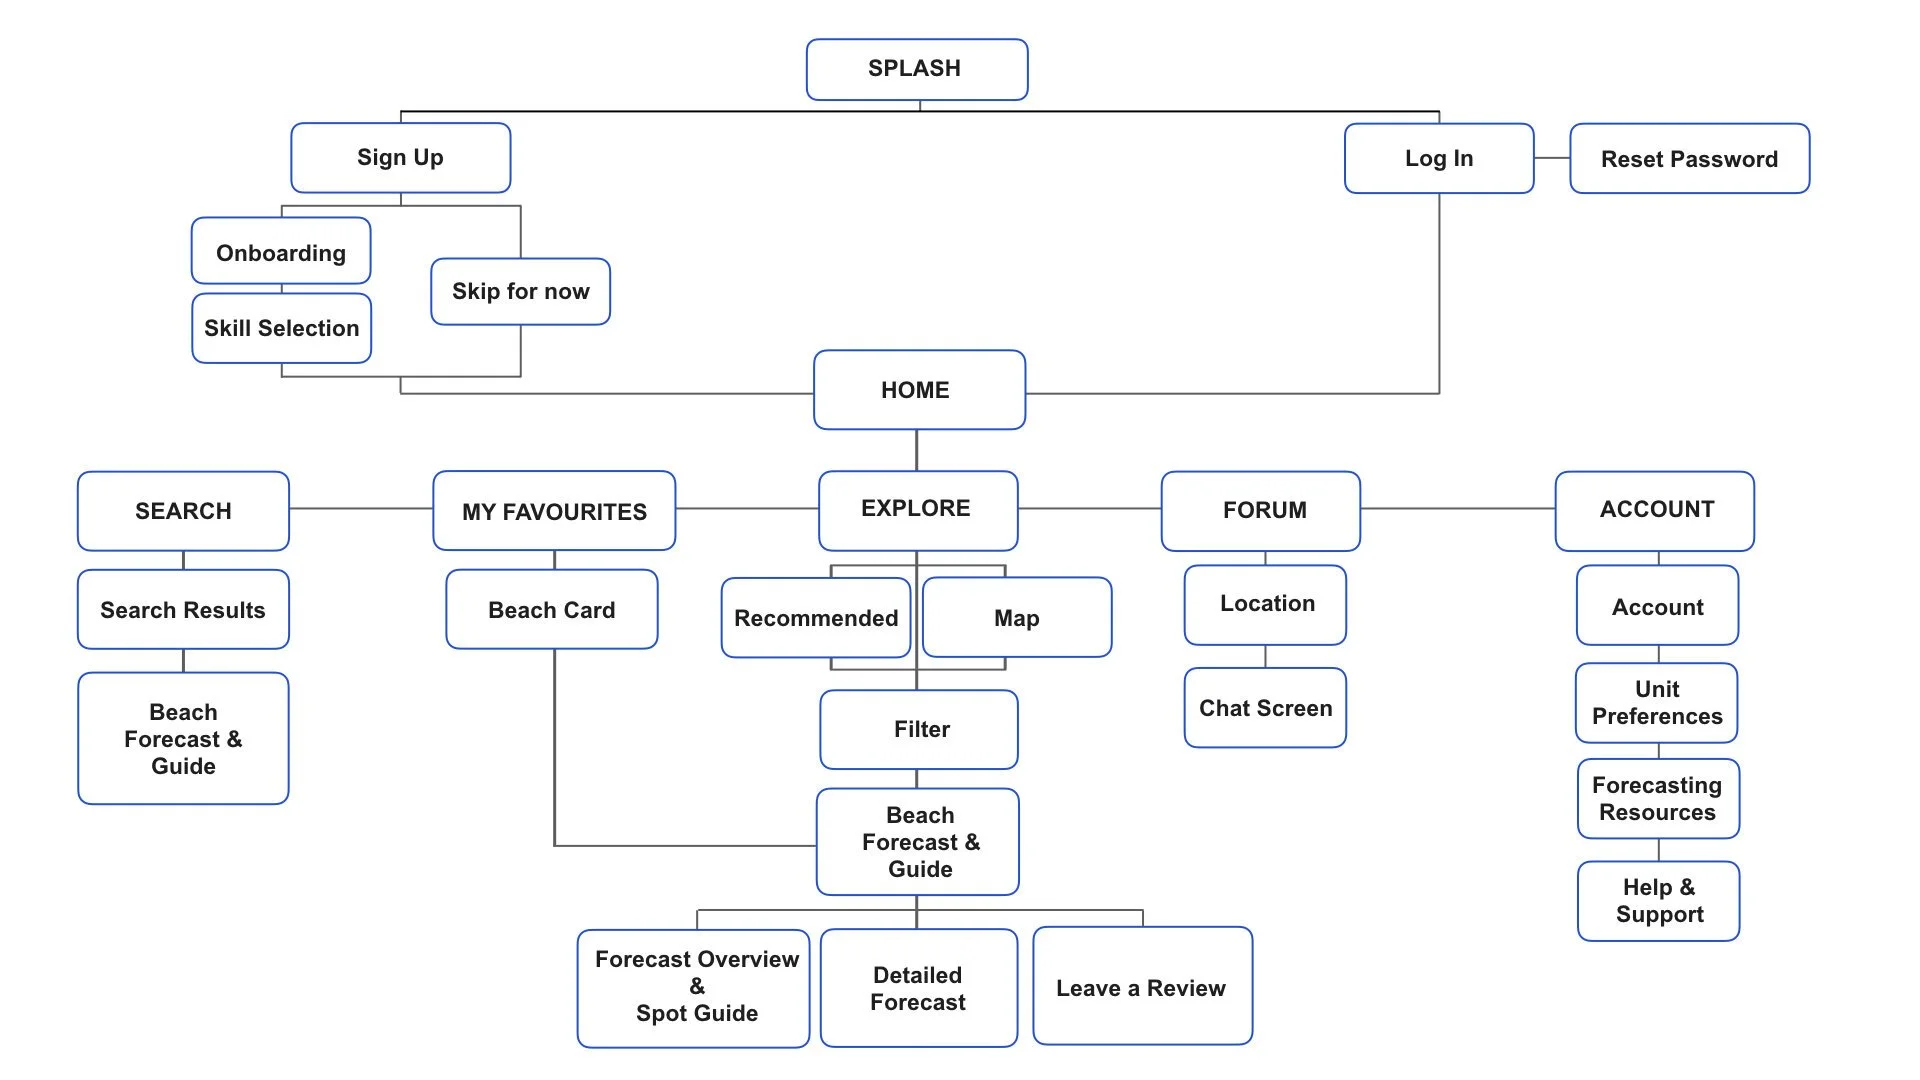
Sitemap
With these core features in mind, I conducted a card sort to gain insight as to how users might expect the content to be organised and displayed, and used the results to create a sitemap.
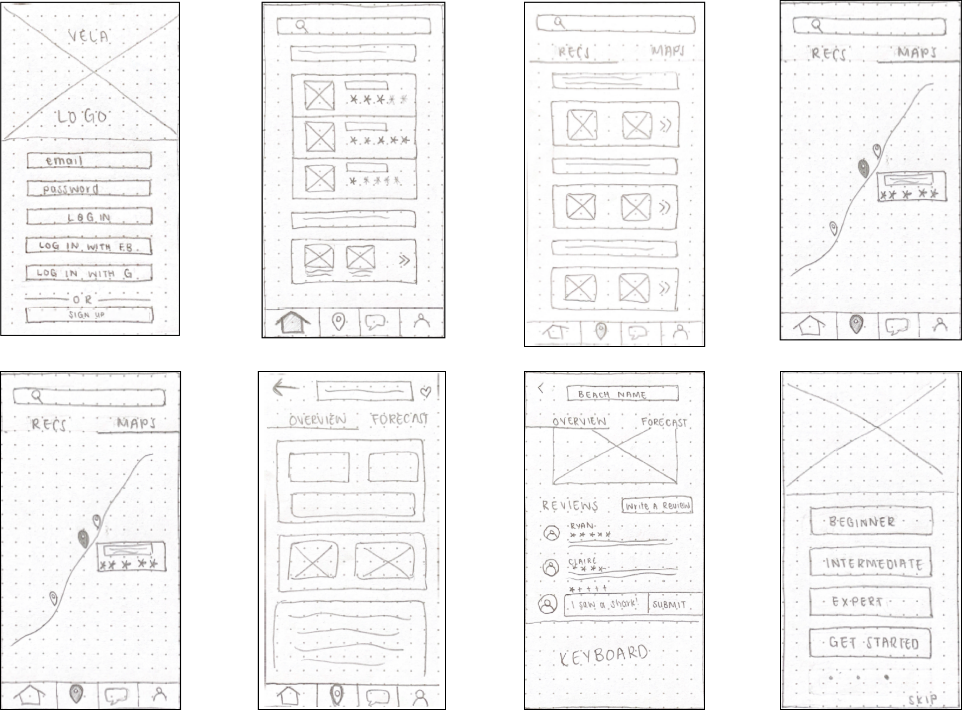
Low Fidelity Wireframes
Since simplicity and ease of use are one of the biggest aims of Wave, the number of screens were kept to a minimum and I wanted to focus on highlighting the core features. I started with pen and paper wireframes, and created multiple versions of each screen until I found a combination of features and elements that I thought matched the users needs and that would be as intuitive as much as possible.
Usability Testing
This phase was the game changer - by conducting usability tests, I was able to refine what users were finding useful, and completely change up what they didn’t react well to. The users were asked complete a few scenario-based tasks that would test the main features of the app, and were asked how they felt about the app in general. The results of the usability tests were recorded and analysed using a rainbow spreadsheet and an affinity map.
Key Findings
I made notes of the positive and negative feedback, so that I knew what areas to keep expanding upon and what needed to be reworked.
Positive
1. Users were able to complete tasks quickly.
2. Users enjoyed the concept of different surf levels.
3. Navigation proved easy for users to understand.
Keep It Simple
Users were unwilling to take the time to learn forecasts. As such, I knew that I should take a simplistic approach with data presentation, and make the forecast information easy to understand.
Tailor to Skill Level
As expected, there was a definite difference in user needs between the three surf skill levels. I decided that forecast information should be tailored to suit each skill level.
Give A Little Extra
Users were interested in reading up extra information about each beach. I decided to also include a “surf spot guide” to help enhance users’ research experience.
User Stories
Finally, I created user stories that I could use to better understand the potential needs of surfers, to help decide on the functional requirements for Wave, and that I could refer back to throughout the project to keep focused.
Problem Statement
Surfers of every skill level need a way to find easily understandable and reliable forecasts before heading out for their surf session, because they need to make informed and safe decisions about their surf activities for the day.
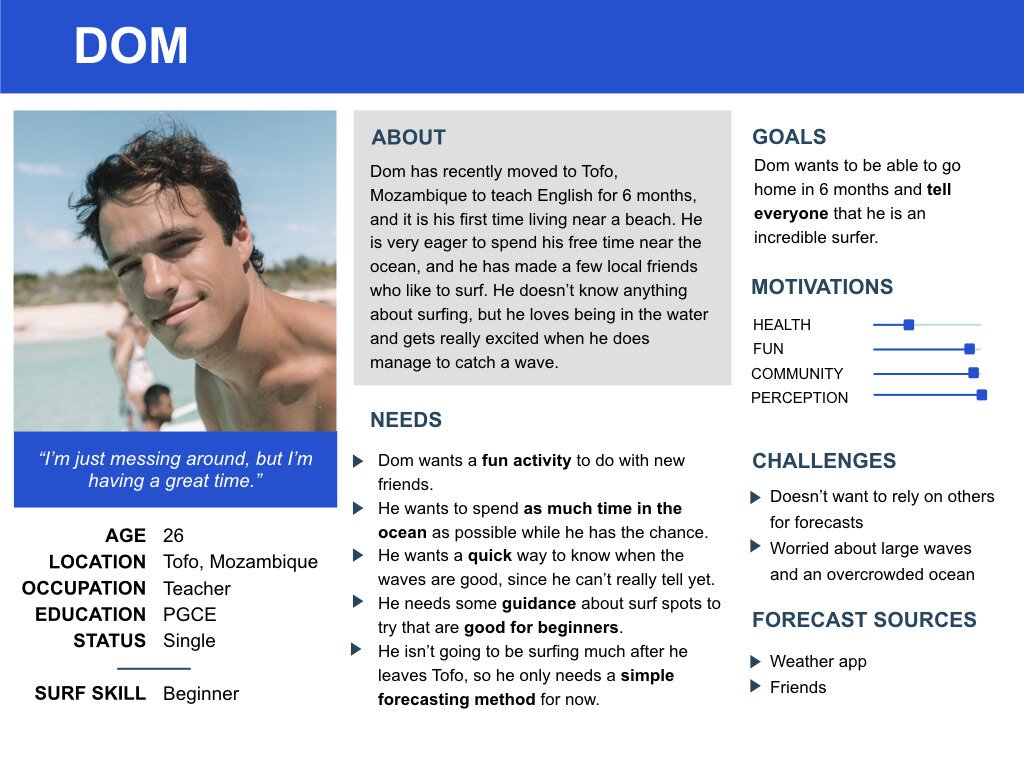
User Personas
Since one of the key findings from my user research was the fact that users of varying surf skill levels have different needs, three user personas were created - namely for a beginner, intermediate and expert level surfer. I revisited these user personas often in order to remind myself of the needs and frustrations of my users, and to maintain a user-centric focus for the duration of the project.
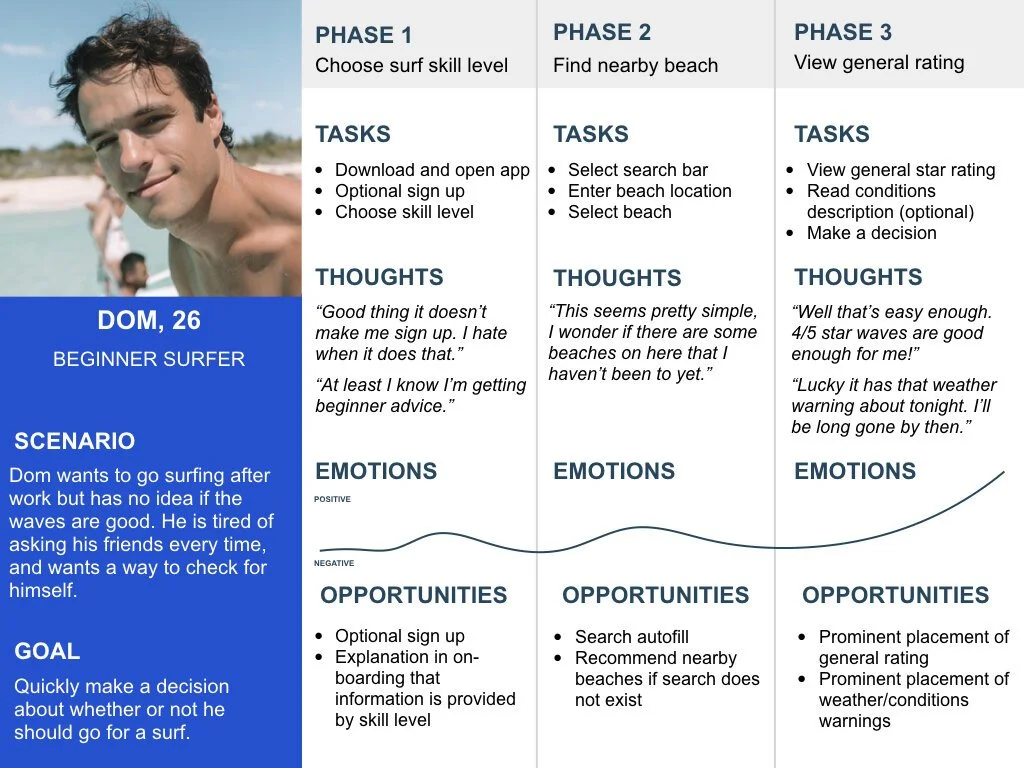
Mental Models
Using all of the research collected, I created a mental model for each user persona in order to understand how the user might interact with the app, and to create a more intuitive user experience.
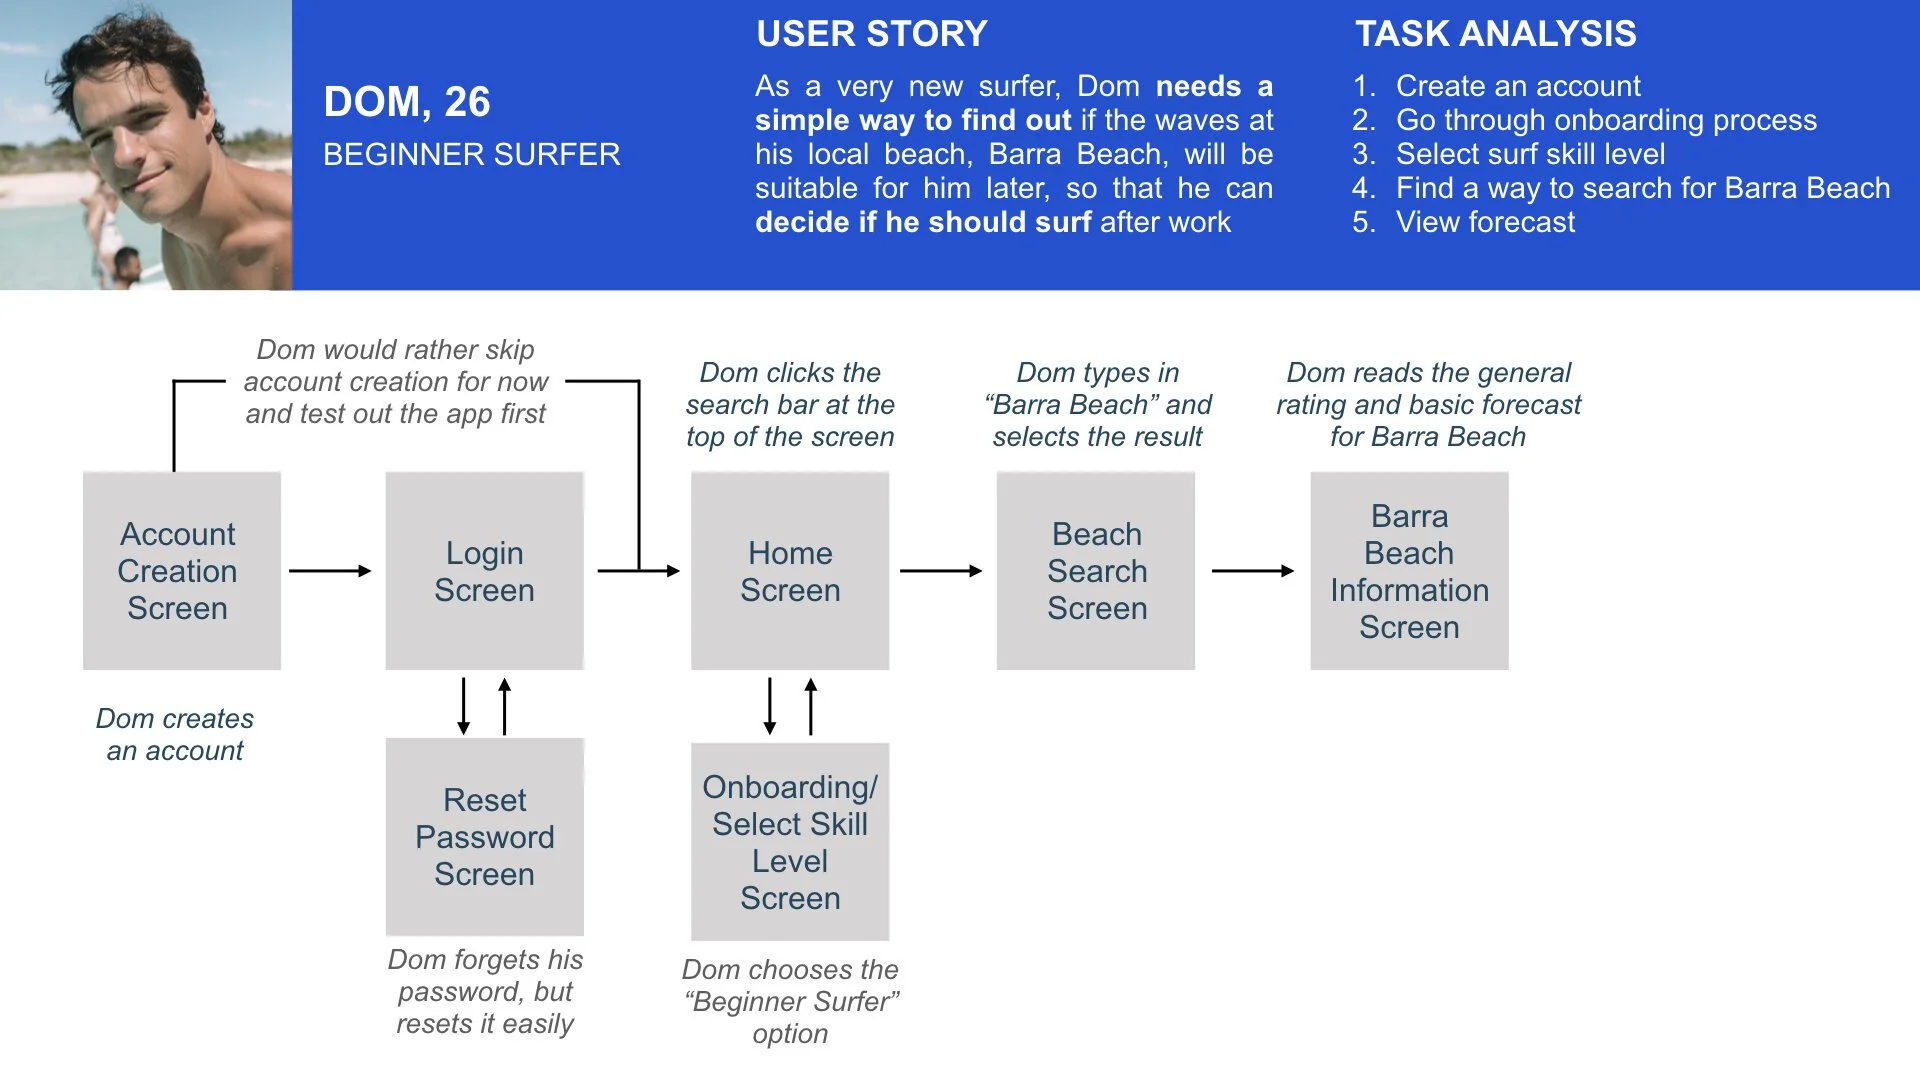
User Flows & Task Analyses
Finally, I created a task analysis and user flow for each persona. This gave me a clear picture of the steps that the user would need to take to get to their final goal, and how to deliver this goal in the most effective manner possible.
Negative
1. Users were confused with the forecast layout.
2. Users had some trouble finding information.
3. Users found text and icons to be too small.
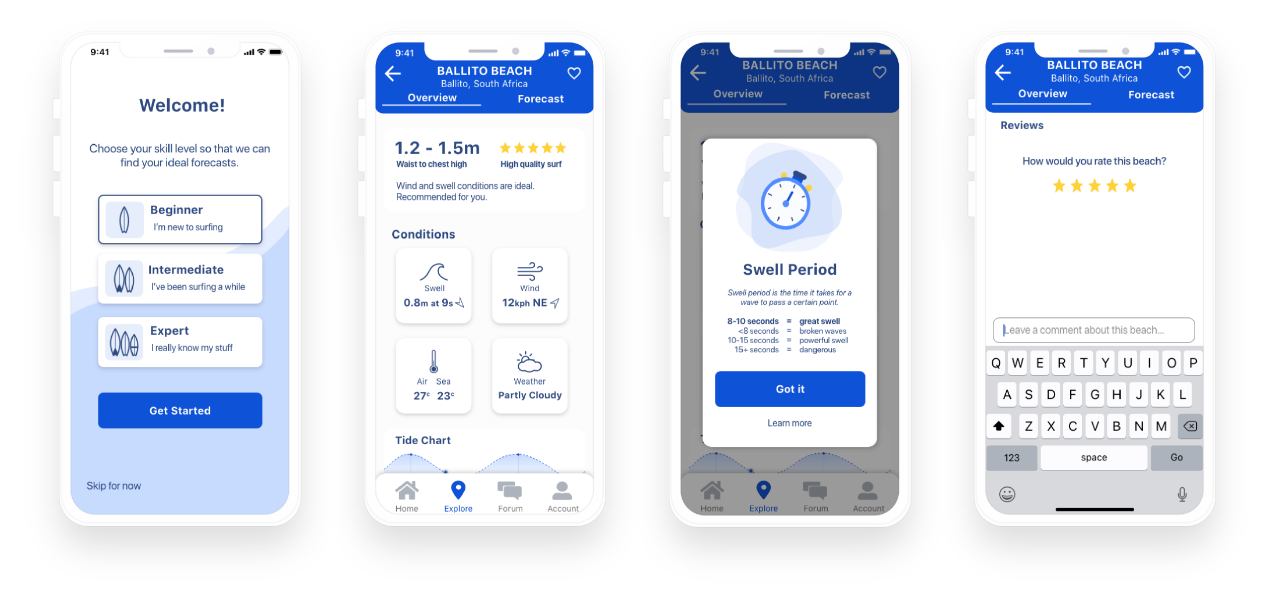
Design Changes
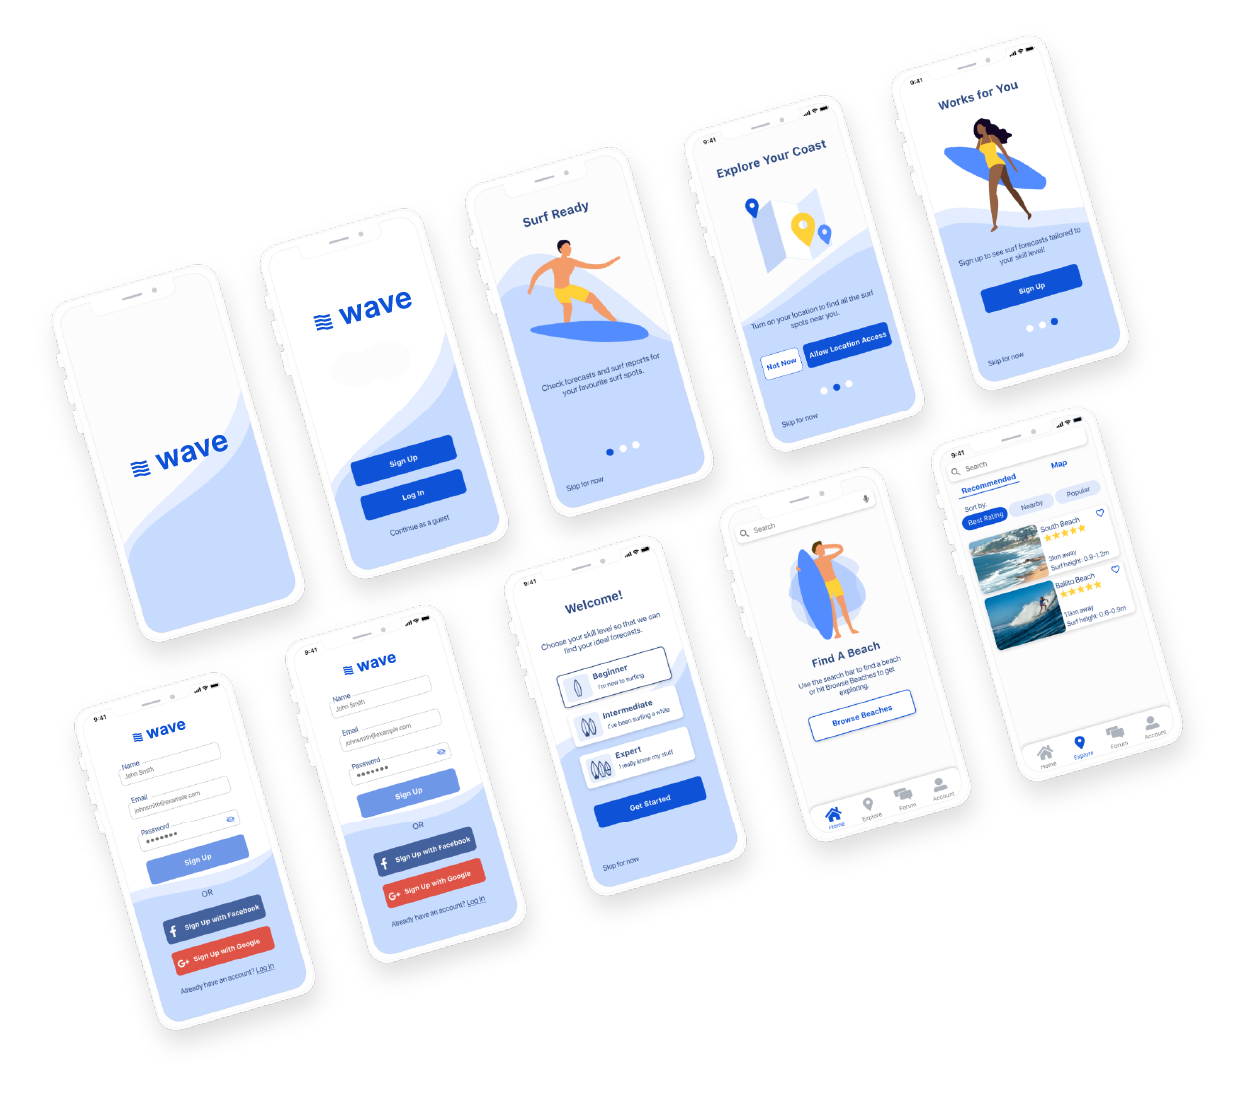
I made changes based on the user feedback and then reached out for additional feedback from some fellow designers. I created a newer, high-fidelity version of the app that featured more white space, larger icons and clearer text.
To this design, I applied the Gestalt Principles, colour theory and made use of grids to ensure consistency within the entire app.

Core features
With a better idea of my user and their needs, I identified three core features that I wanted to focus on for the product.
Accesibility
To these changes, I also added a few of my own after conducting some research on accessibility in design in order to meet WCAG requirements.
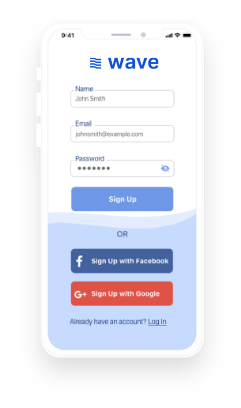
1. Placeholders vs Labels
Originally, Vela’s sign up and log in screens made use of placeholders instead of labels. Now, each form input field has its own label, and the placeholder text provides an example for what the user should type.
2. Adding an indicator state
Originally, the only way for users to know which input field they had clicked on would be the flashing text cursor. Now, the border of the selected input field has been highlighted in a darker colour in order to show the user where they have clicked and where they will be typing.
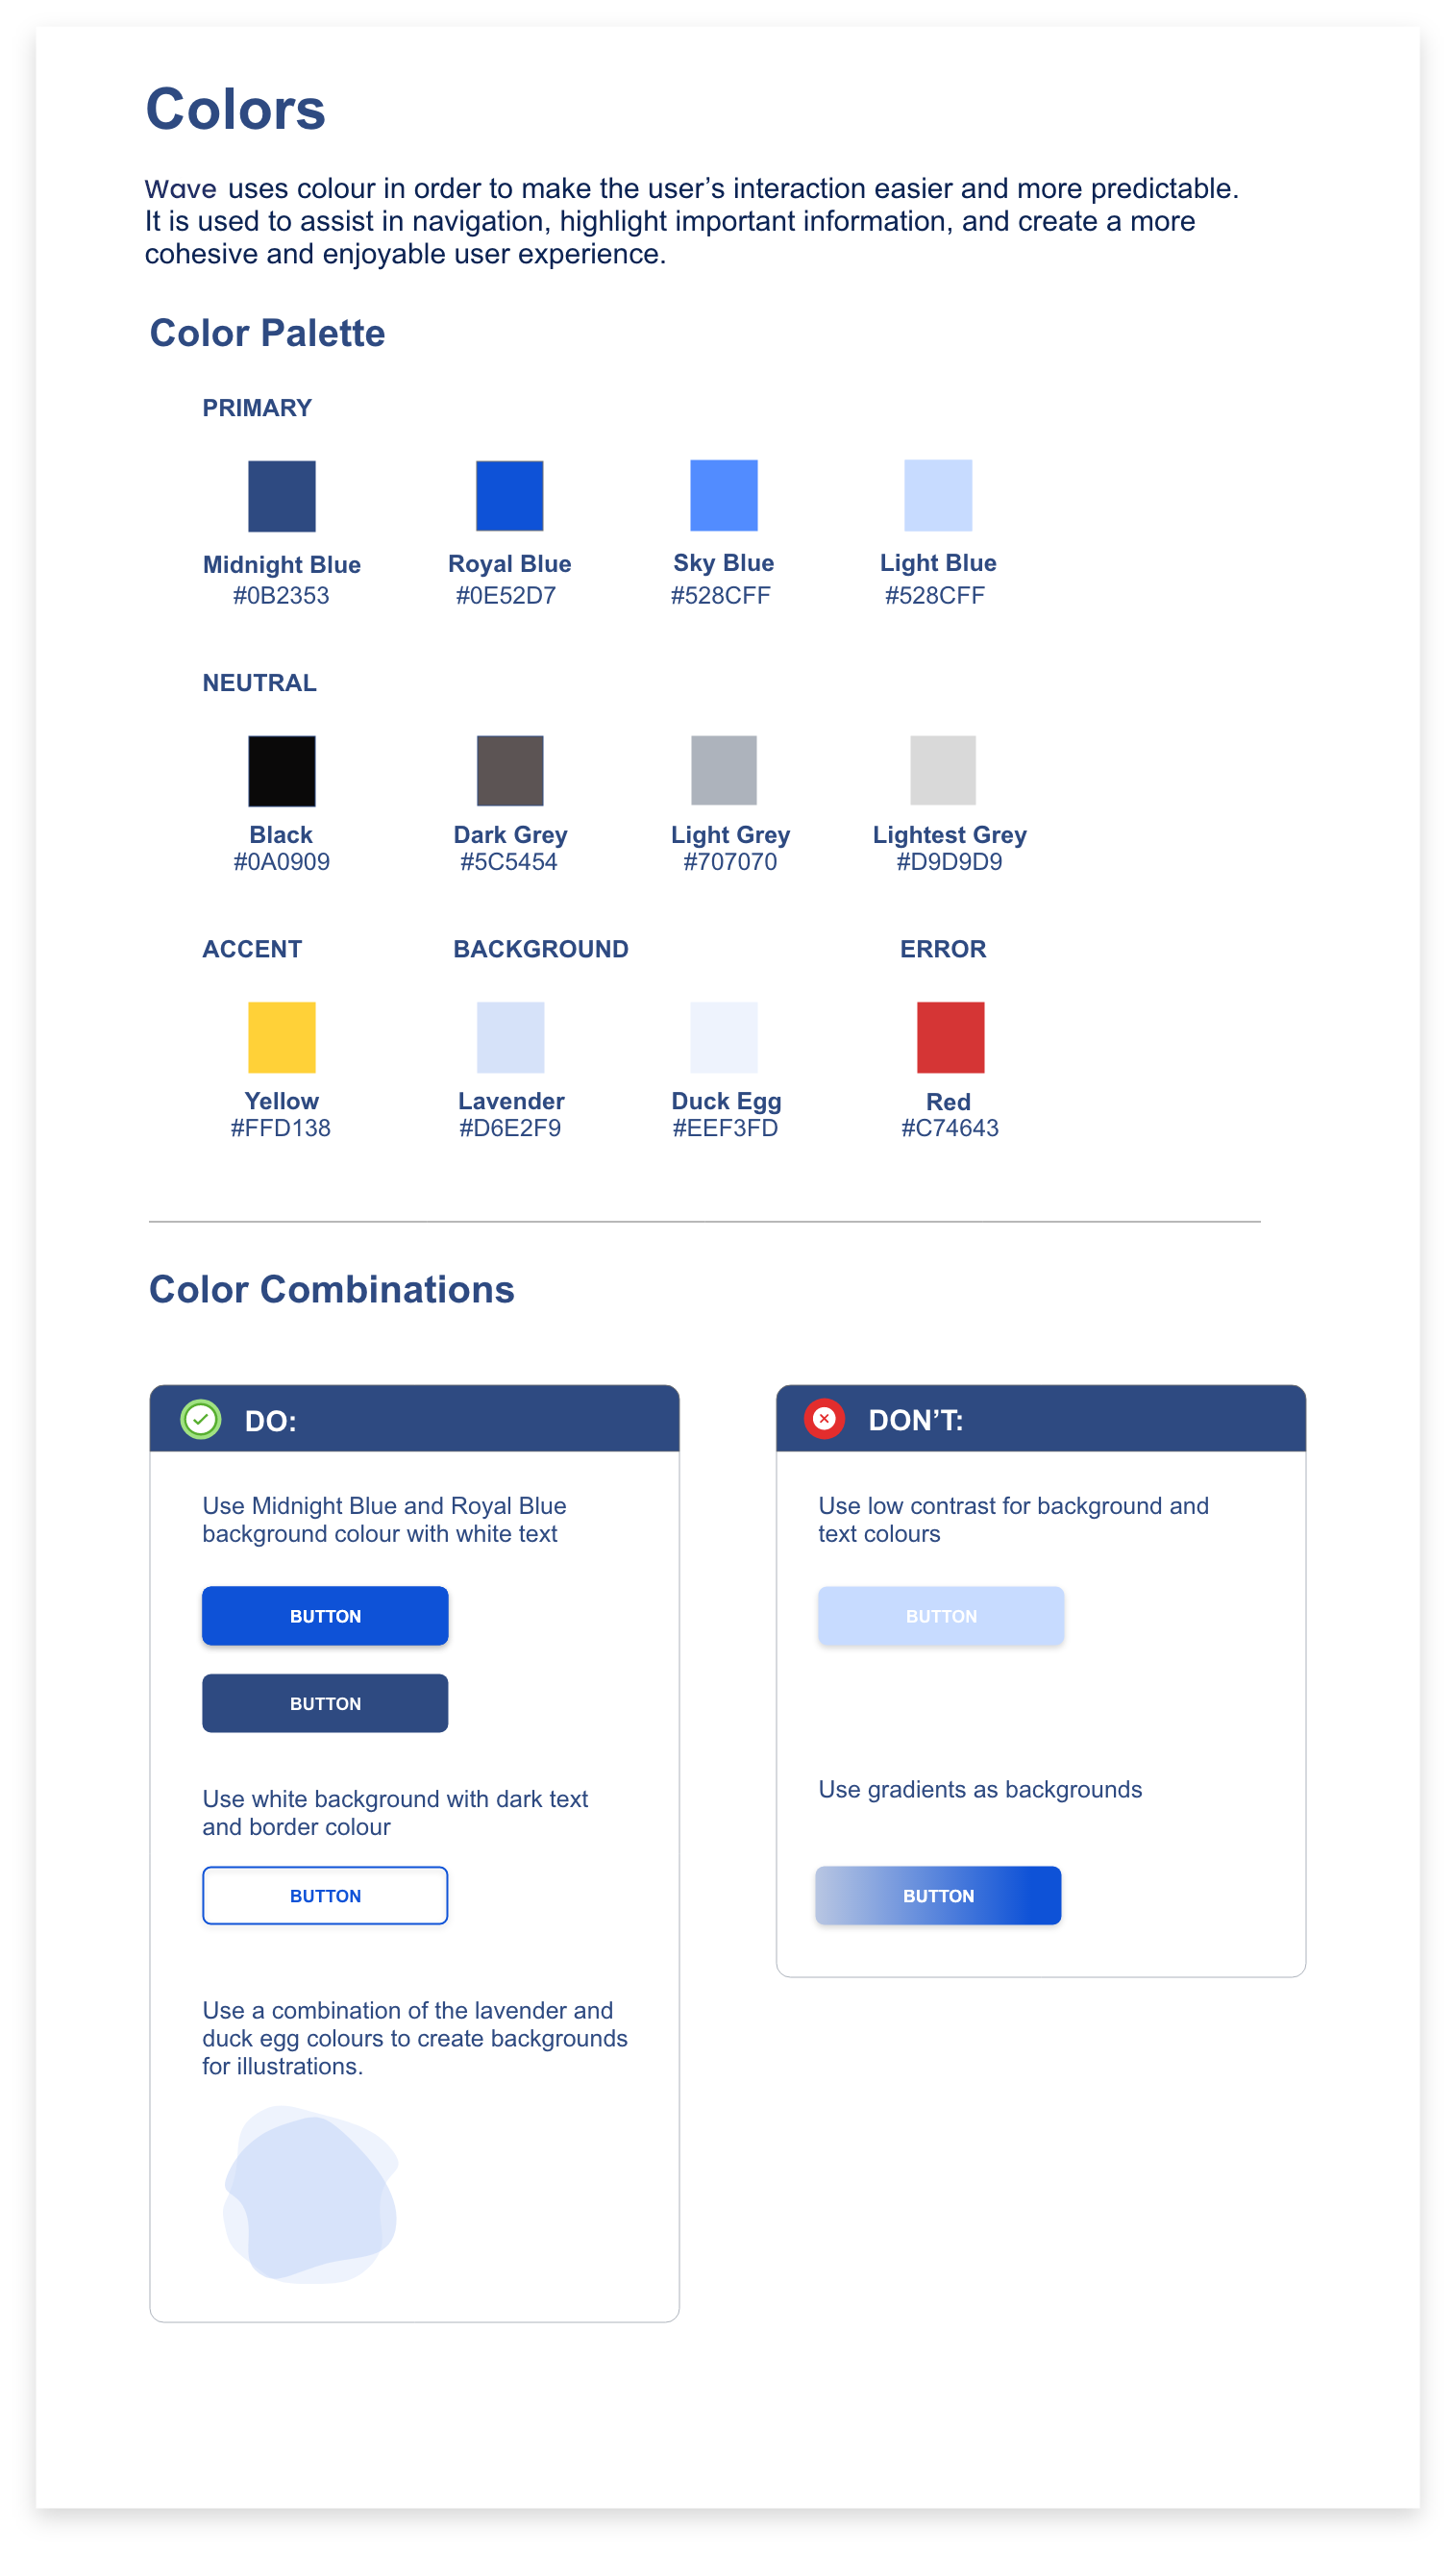
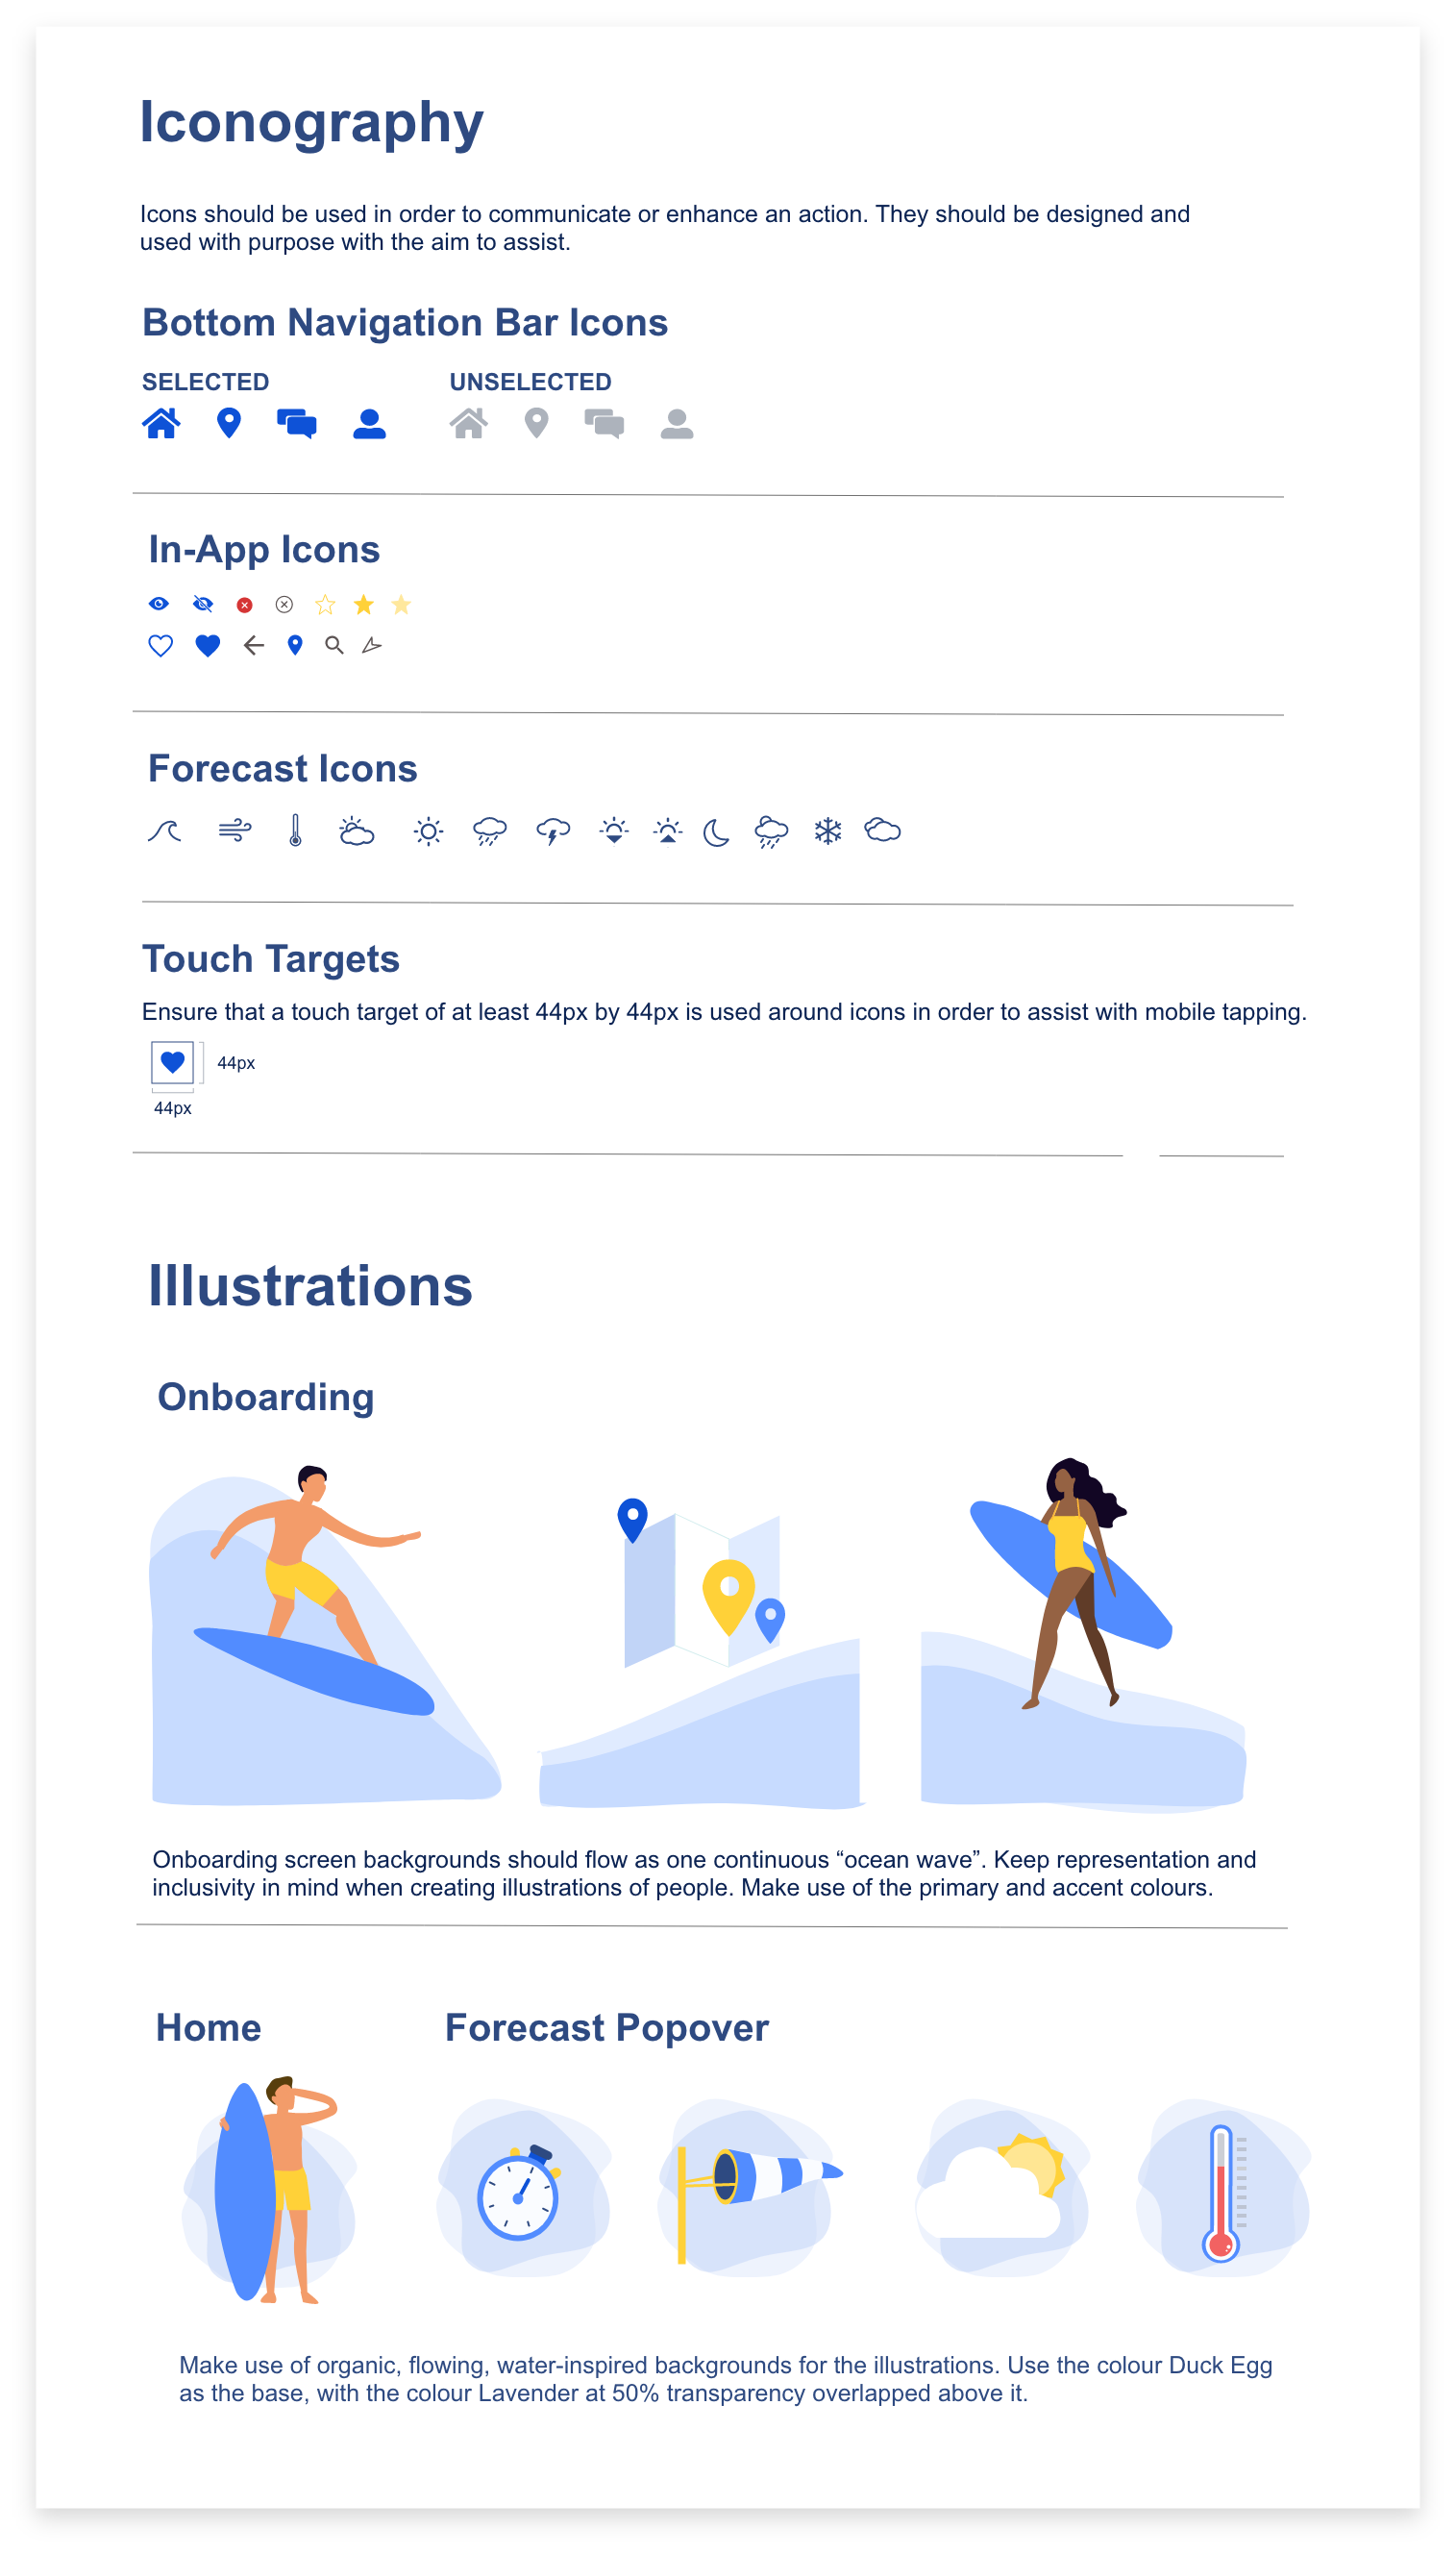
Design System Language
Lastly, I created a design system language that could be followed in the future to ensure consistency throughout the app.
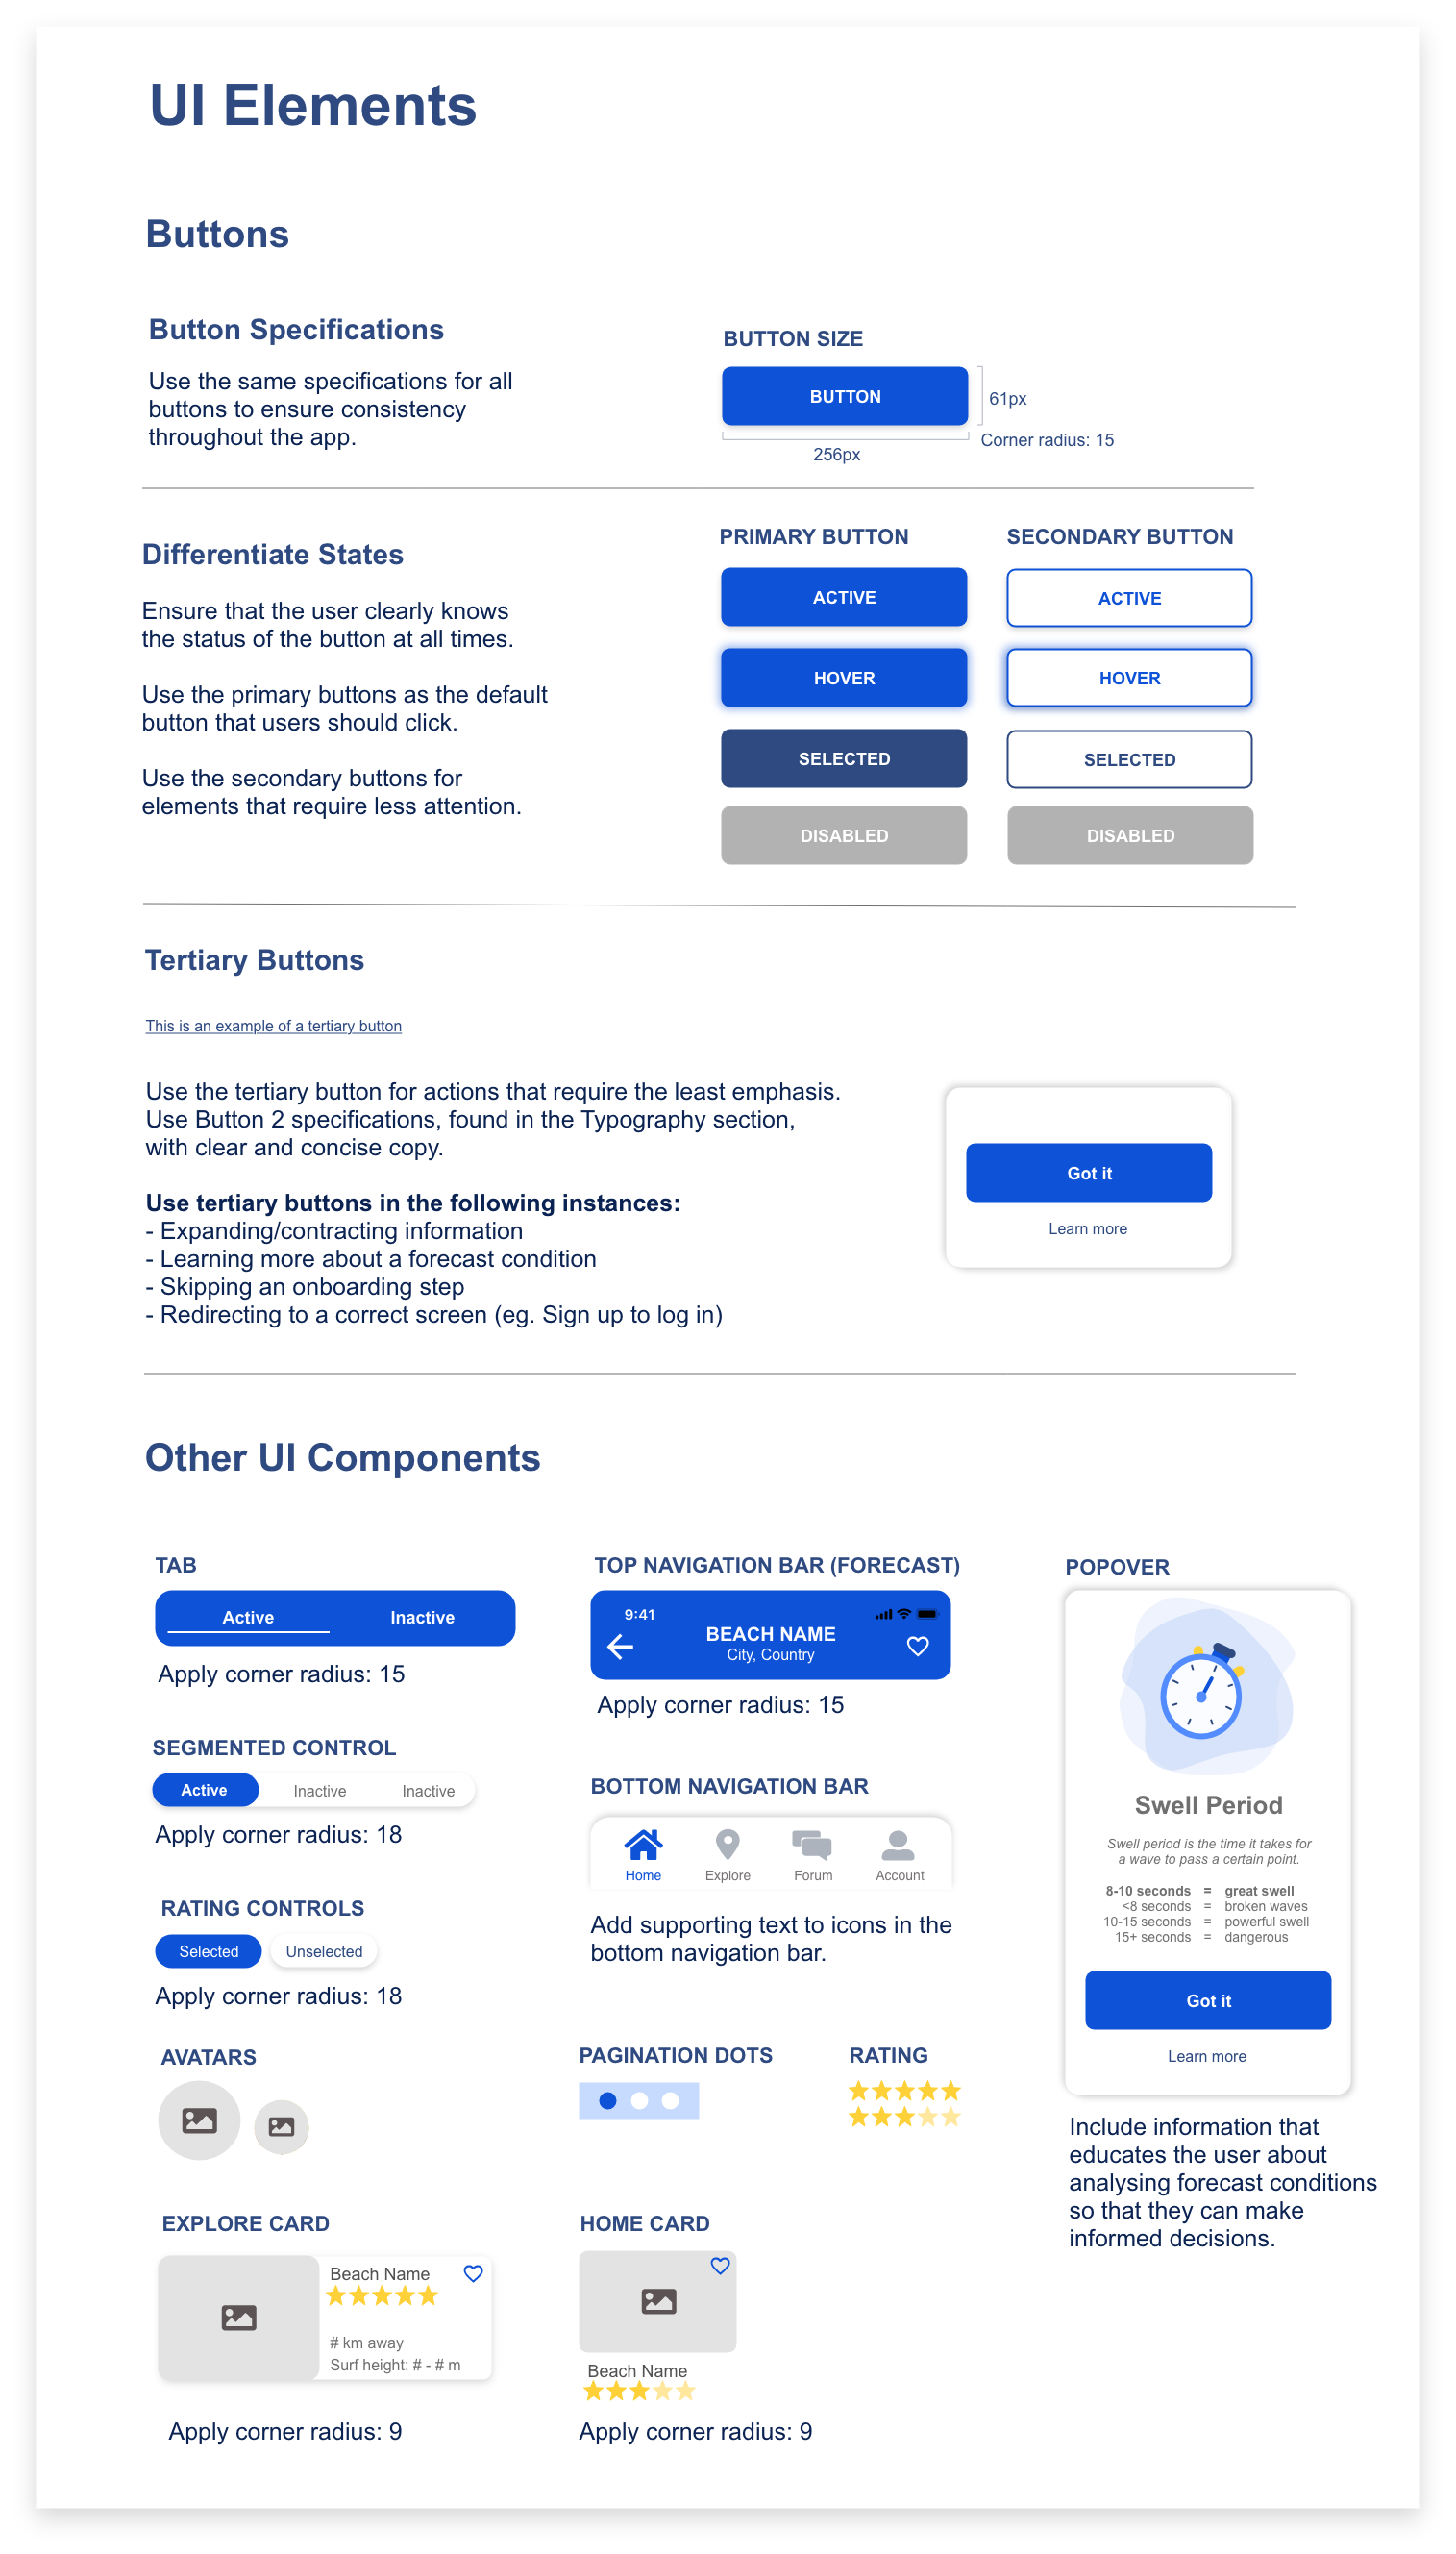
After many tests and iterations, my final product aligned with all of the objectives I had set in place - it includes the three core features necessary for users to find surf reports quickly and easily, while appearing visually appealing and simple to use.
Challenges
My biggest challenge was a struggle with the data visualisation for my surf forecast overviews. My usability tests proved that the entire forecast screen was just too small, and there was too much information for users to properly comprehend. Since the surf forecasts are the main feature of the app, I spent a lot of time creating iterations that would provide the users with data that was easy to understand, that also was also displayed beautifully. This pushed back my timeline somewhat, and I could not spend enough time on some other aspects of the design, such as iconography.